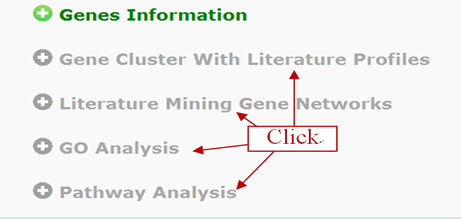
4 Gene Cluster With Literature Profiles
5 Literature Mining Gene Networks
Given a set of genes, for example from high-throughput experiments, it can be helpful to know which biological functions and molecular networks may be involved, or whether genes from a given list or all human genes are related to certain topics, such as various biological and pathological processes. Some pre-defined annotation databases, such as GO (Gene Ontology), or pathway databases, such as KEGG, or PPI (Protein-Protein interaction) databases, such as HPRD and IntAct can be used as a gold-standard description.Some annotation tools that integrate these manually curated databases, such as DAVID and EGAN provide convenient and practical application. However, due to structured vocabularies and manual curations, pre-defined annotations are inevitably limited in scope, quantity and flexibility. Here, we developed a web server GenCLiP 2.0 (http://ci.smu.edu.cn) from our previous stand-alone software GenCLiP. Compared with other similar tools, such as DAVID, PubGene, iHOP, and STRING, the unique characters of GenCLiP 2.0 are:
i) analyze the gene functions with free terms generated by literature mining or provided by user;
ii) precisely identify and integrate comprehensive molecular interactions from the entire PubMed, to construct interaction networks and sub-networks related with free terms.
For analysis, the user needs to upload a list of gene IDs. Gene Cluster With Literature Profiles module will generate statistically over-represented keywords grouped by a fuzzy cluster algorithm to annotate the input genes. The keywords were generated based on occurrence frequencies of free terms in gene related literature or can be provided by user. The relationships of genes and keywords are linked to the relevant Medline abstracts in which co-occurrence of genes and keywords are highlighted. Also this module can generate heat-map of genes and selected keywords using the average linkage hierarchical clustering algorithm. Literature Mining Gene Networks module will construct a gene-network of the input genes and generate sub-networks based on the user defined query terms, at the same time calculate the probability of random occurrence of the networks through random simulation. The edge of networks represents the association of two genes and link to their related literatures. In addition, the Word Related Gene Search module can query genes co-occured with input terms in a sentence or abstract.
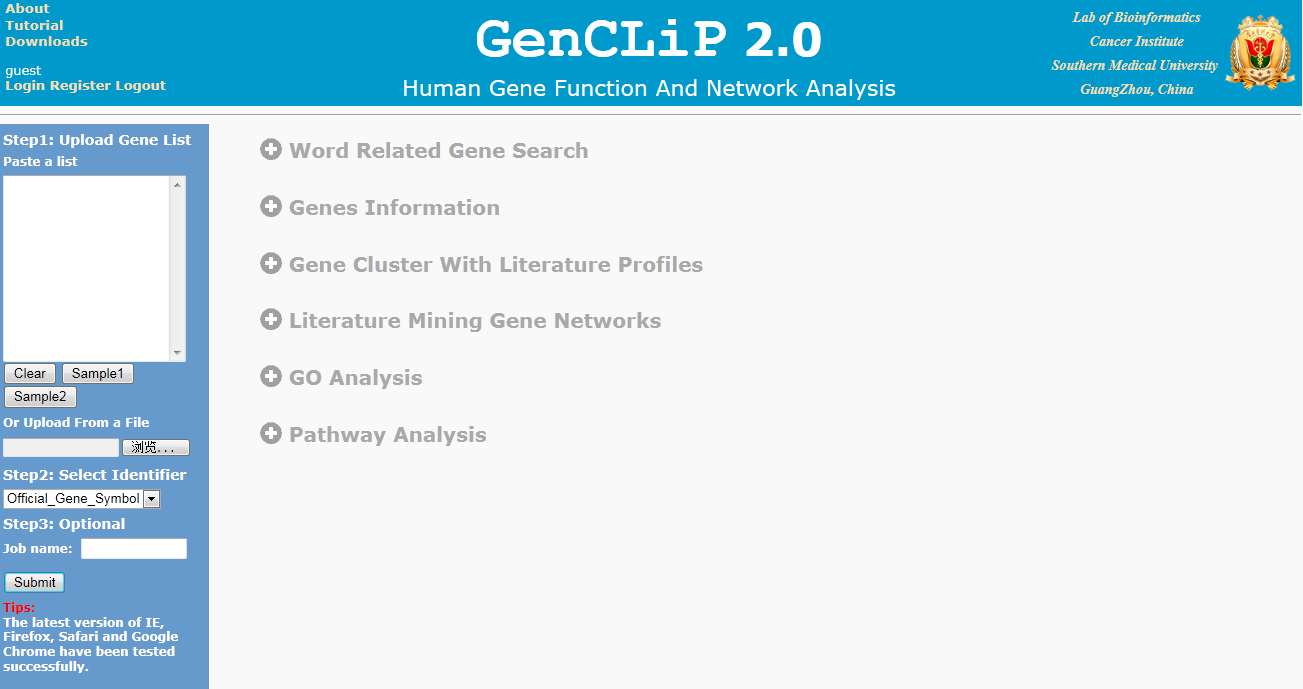
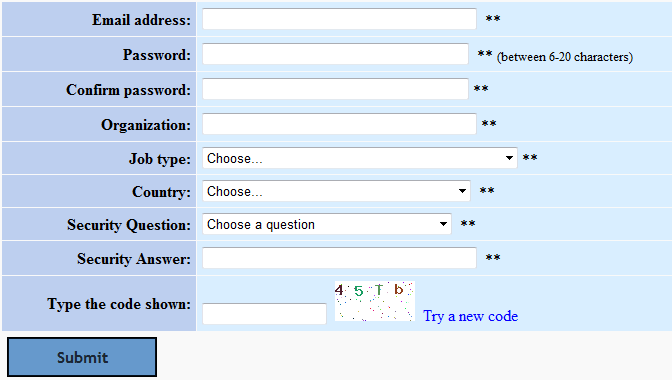
Click the Login text link at the top of the page opens a new page requesting your Email (username) and password. If you have not been previously registered with GenCLiP 2.0, there is a link to the register page. If you have already registered but forgotten your password, you can regain your password.
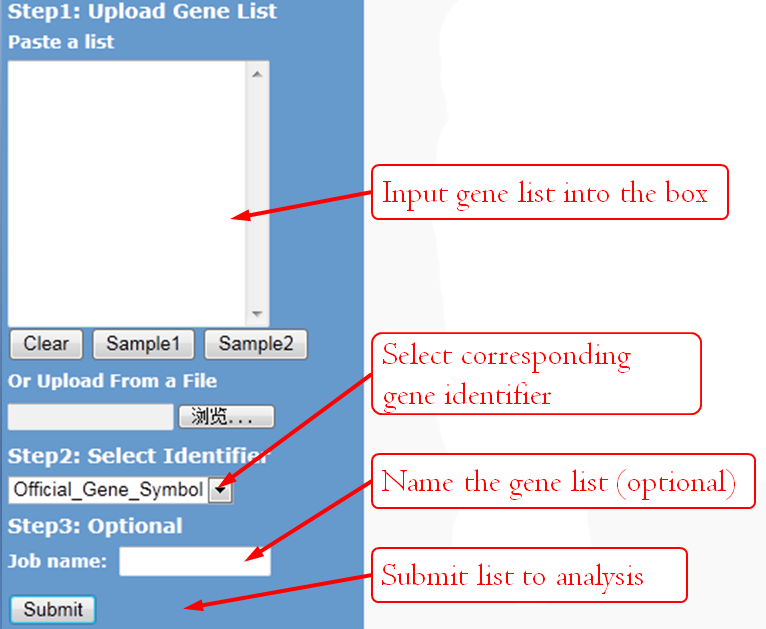
GenCLiP 2.0 accepts four types of gene accessions/IDs. Users can view all the gene accession options from the drop-down selection menu at the input page.
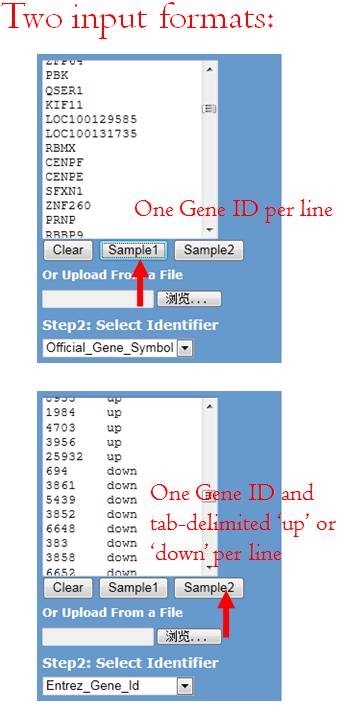
You can either load a gene list from a .txt file or paste a gene list to the text box. Two formats are supported:
- One Gene ID per line, refer Sample 1.
- One Gene ID and tab-delimited 'up' or 'down' per line, refer Sample 2 .
For user-defined up- and down-regulated genes, the software distinguish gene name in color, red represented up-regulated, green represents down-regulated gene.
Please note that, a gene list that over 3000 genes is forbidden.
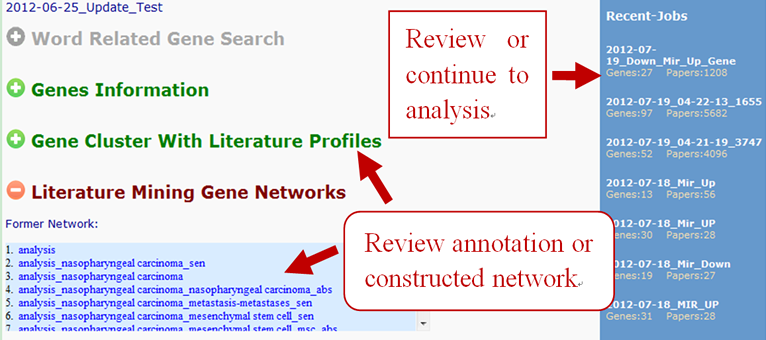
For registered users, name your job if you wish, that name can help you to retrieve the job later easily, or the system will automatically name it by a random number and the time you submitted. Unregistered users have no permission to retrieve former analysis, so ignore this option.
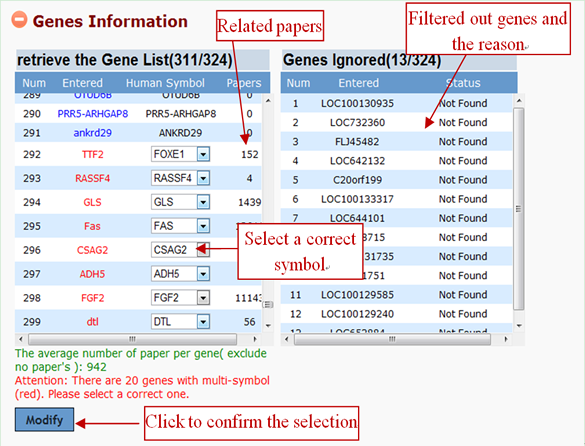
After the gene list is submitted to GenCLiP 2.0, system will screen the database and return the gene identification information. It is able to attach meaning to a list of gene accessions/IDs by rapidly translating them into their corresponding symbol, and to sort input genes alphabetically in the information box. Please note that, many gene synonyms are ambiguous, thus one and the same synonym is often used for different genes. Users can select a correct gene through the drop-down selection menu, and click "Modify" button to change.
Click the grey icon and the module name to begin further analysis.
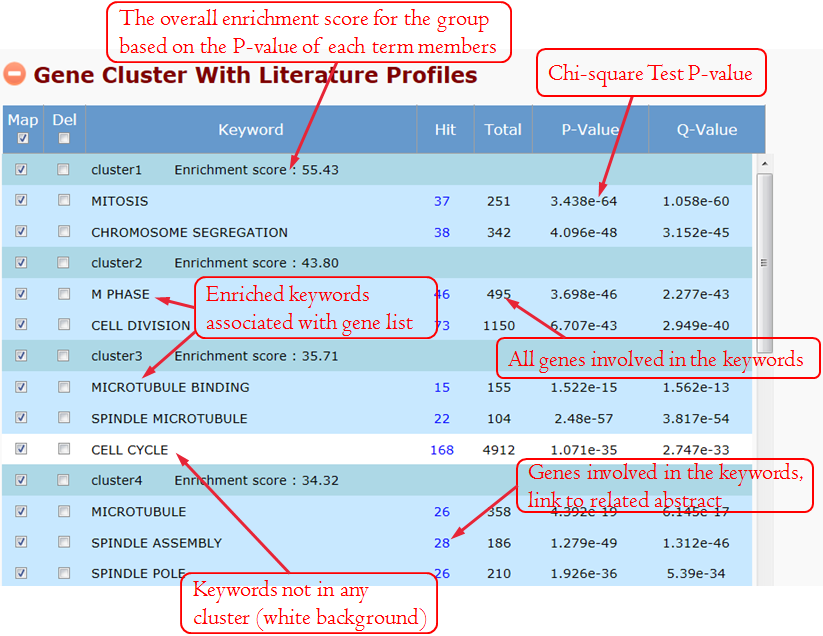
This module focuses on gene annotation based on the free word. There are two ways to apply keywords, automatic and manual. The user can add relevant keywords and remove inappropriate keywords. The purpose of keywords' editing is to allow you to find the topics that relate to a particular part of your research. Users themselves should play critical roles in judging "are the results making sense or not for expected biology?".
We extracted keywords to annotate genes in advance. The keyword includes non-public words and phrases, which are highly appearance in gene's literature. When the user clicks the grey icon, system will extract the keywords automatically. After several seconds' processing, this section will be expanded, and the annotation table and the optional panel will be showed. For unexpected keywords, users can remove them. For expected keywords but cannot be generated automatically, users can add them manually. The keywords' enrichment results are classified to multiple groups clearly and concisely using a fuzzy cluster algorithm (see the detail at 8 Fuzzy Cluster).
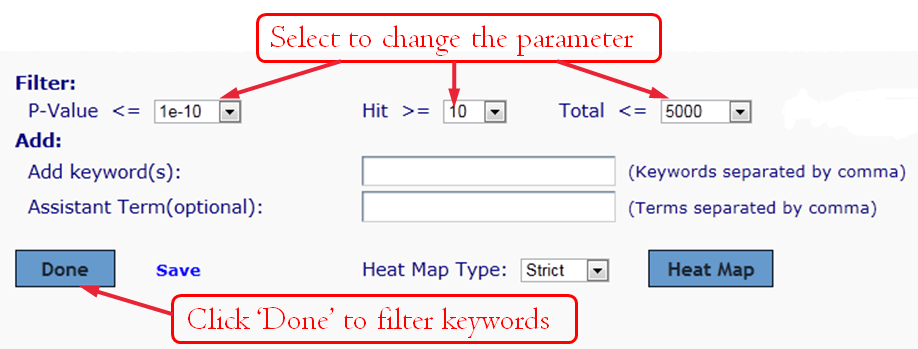
Manually editing--Filter Keywords:
Manually editing--Delete Keywords:
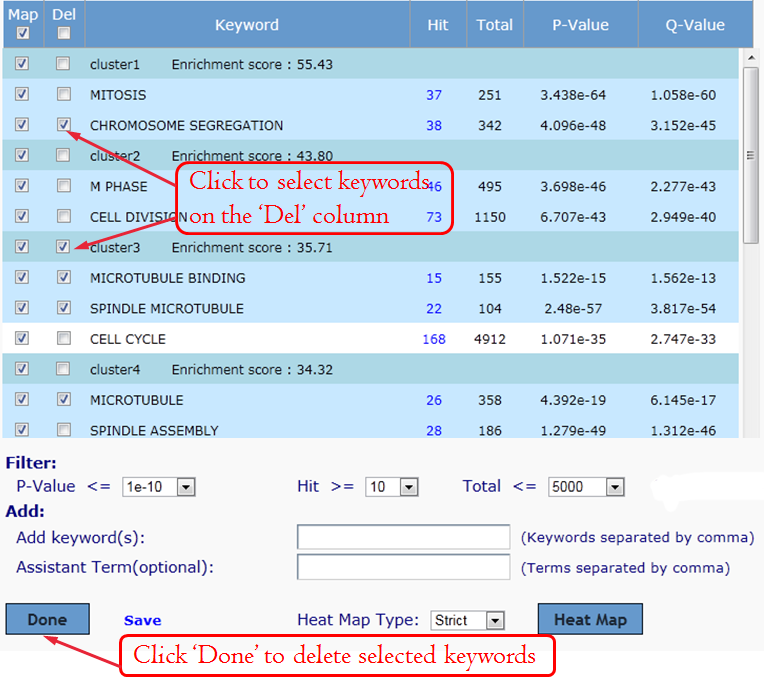
To save your annotated result from your browser to your hard drive simply click the link "Save" then type your filename and save to your hard drive. You can then open this file in Microsoft Excel.
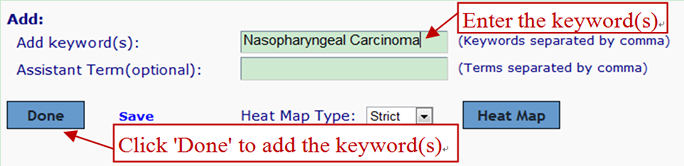
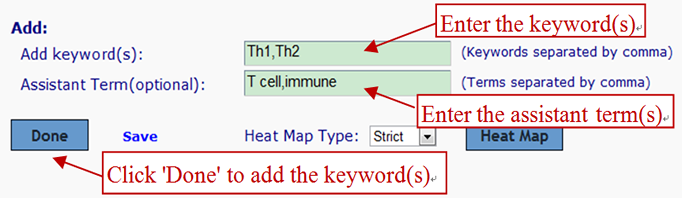
Manually editing--Add Keyword:
For the ambiguous keywords, assistant term is helpful for identification. In this case, "Th1" or "Th2" and "T cell" and "immune" must appear in a abstract.
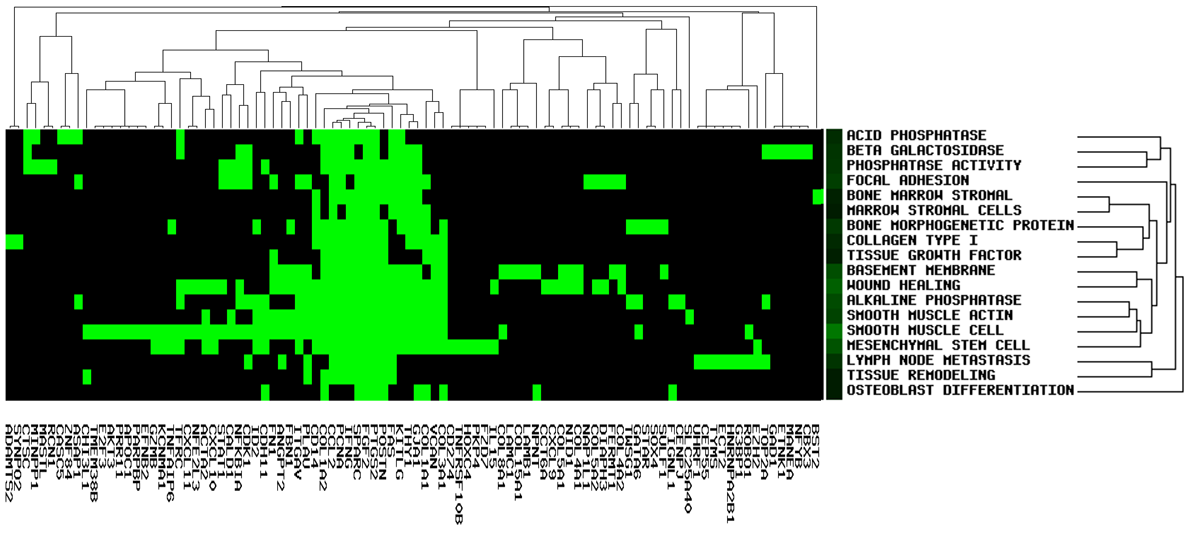
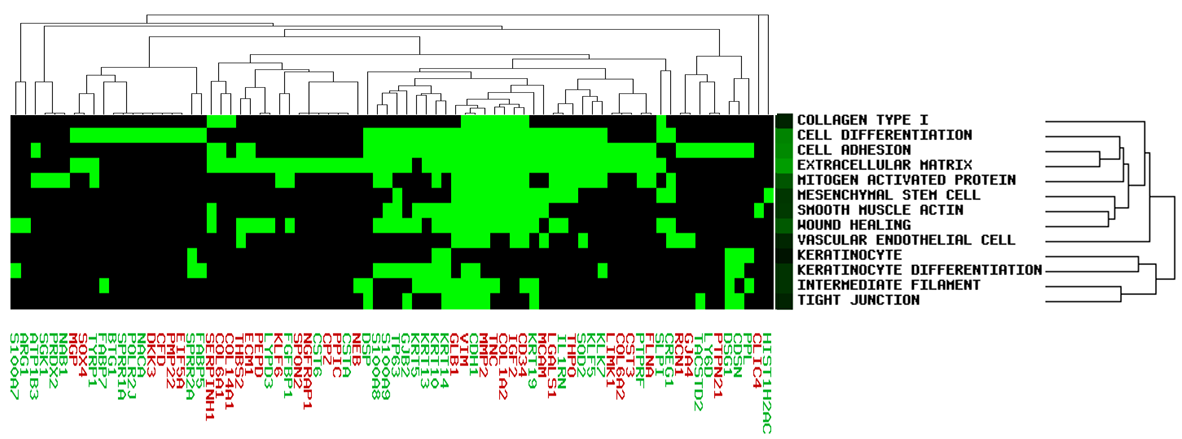
GenCLiP 2.0 uses the gene list and selected keywords for clustering analysis using the average linkage hierarchical clustering algorithm. The cluster results will be displayed in the image box and can be checked easily. User can download the result txt file and input for public software, such as Cluster/Treeview programs.
It allows users to see gene members and their associated annotation term in a heat map type of view so that user can further explore the gene-gene and term-term relationships. This function is also provided for examining the internal relationships among the terms and genes.
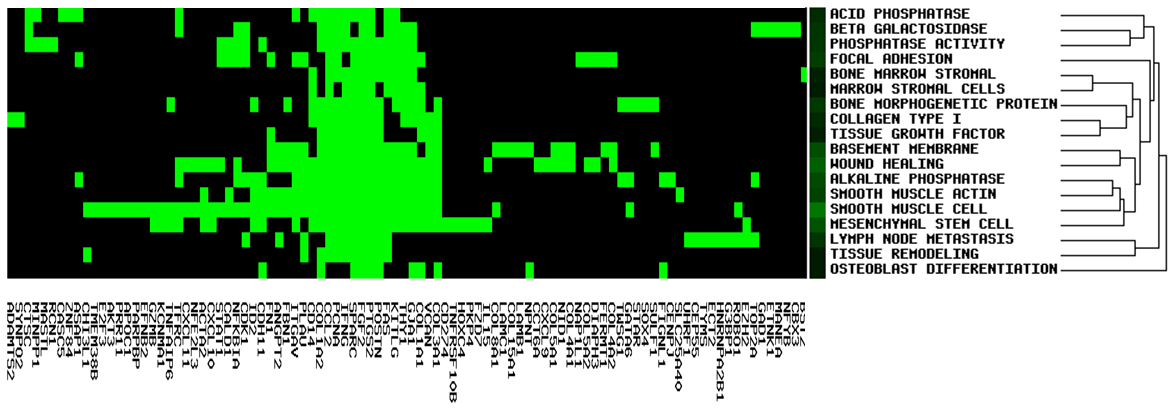
Select terms to proceed cluster analysis:
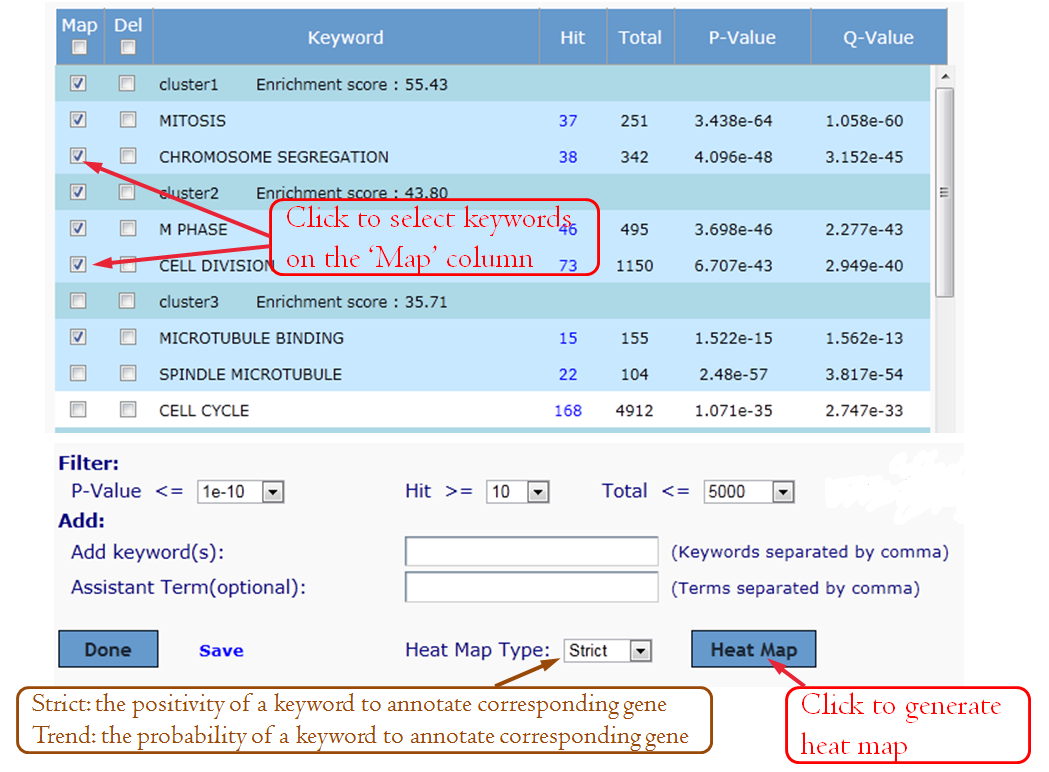
Heat map type of 'Strict'.
Heat map type of 'Trend'.
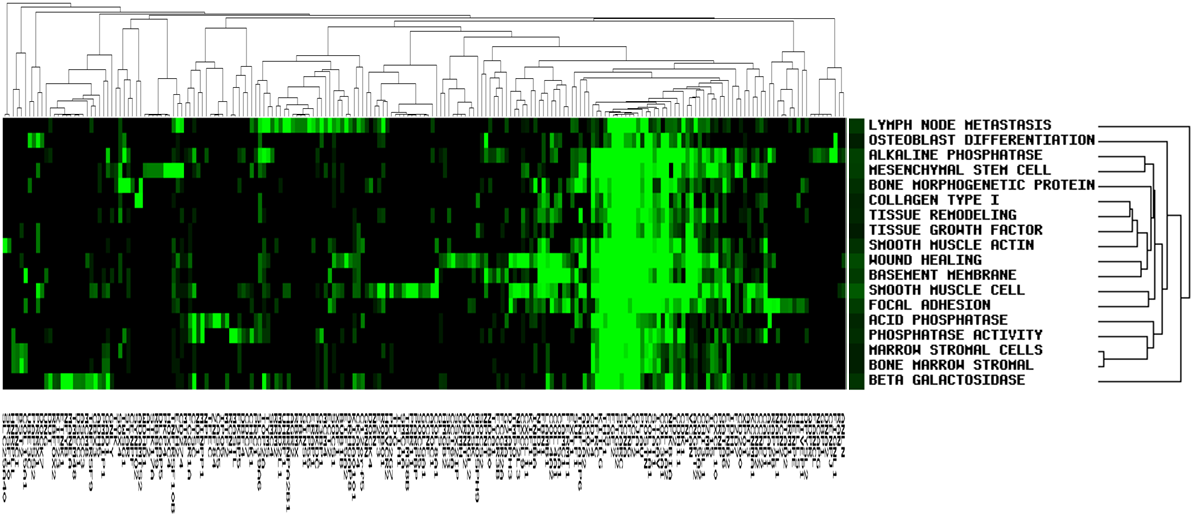
Based on user-defined gene list, red represents up-regulated gene, green represents down-regulated gene.
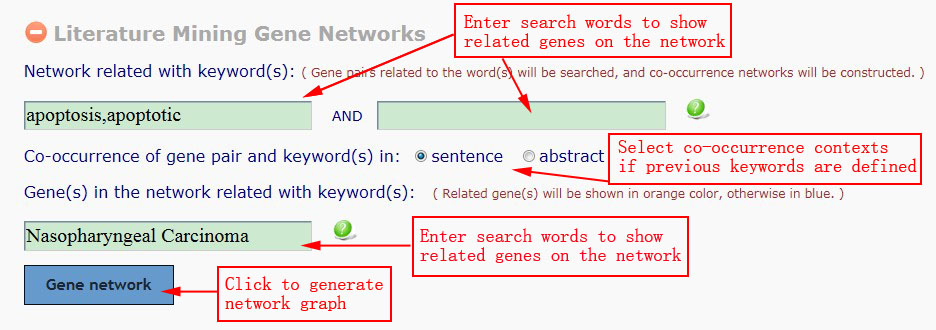
There are three input boxes in this Gene Network module. The first and second input fields (Network related with keyword(s)) are used to search and construct gene co-occurrence networks. An interactive gene pair will be confirmed when the two genes (they must appear in a sentence) and the keywords co-occurrence in a sentence or abstract (depending upon the option selected). All terms will be highlighted on the relevant abstracts.The third input box (Gene(s) in the network related with keyword(s)) is used to decide whether one gene in the result networks will be shown in purple border (related to the input keyword) or not. Genes are considered to relate to this keyword if they co-occurrence in a sentence. For three input boxes, synonyms are supported, more terms are separated by a comma that means "OR". For example, "apoptosis,apoptotic", means "apoptosis" or "apoptotic" appear on the corresponding field will be treated the same.
If the user has not inputted any search terms, then GenCLiP 2.0 will construct the full gene networks for the gene list.
Gene's network construction is combined with limited times of random simulation, so it will be a slow process. Nevertheless, the process is no longer than 1 minute, if the server is running properly.
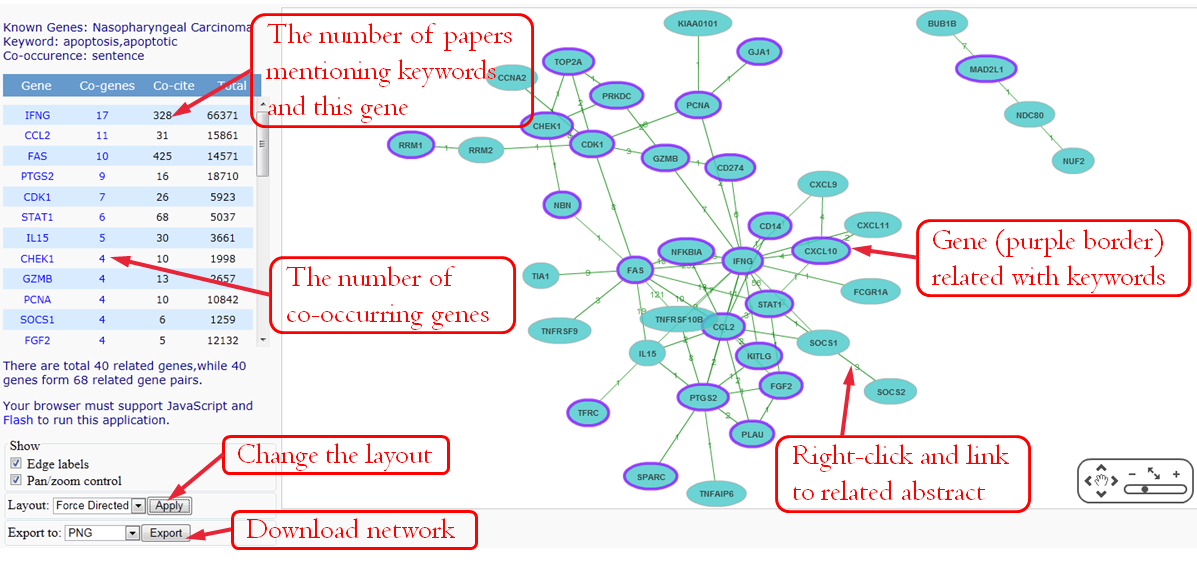
The network is drawn by Cytoscape Web. To make better use of Cytocape web, your browser must support JavaScript and Flash to run this application. If the application is not compatible with your browser, you can try to use another browser.
- Use the Show menu to simplify the view, hide the Edge labels or
- Use the Layout menu to view different arrangements of the network. We set Force-Directed Layout as default.
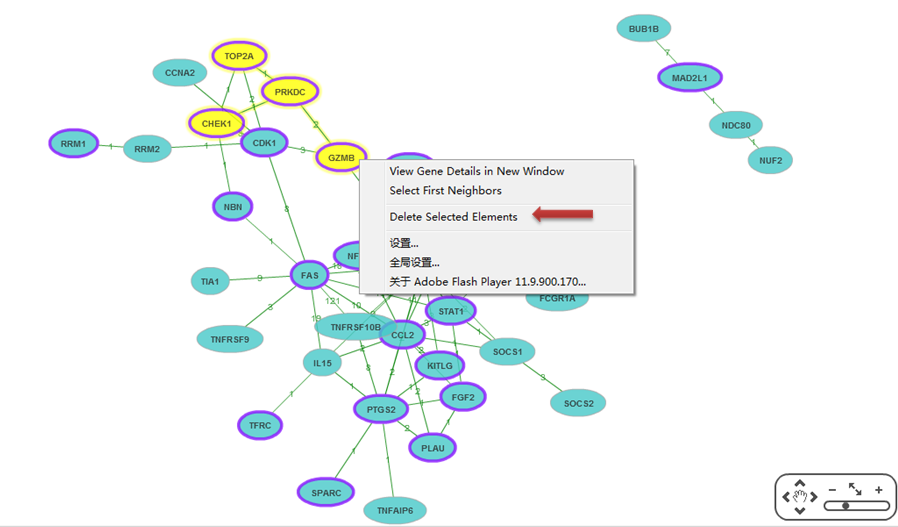
- Click the gene name to highlight (yellow) the gene in the network.
- Select the file format, click the Export button to save the file to local disk.
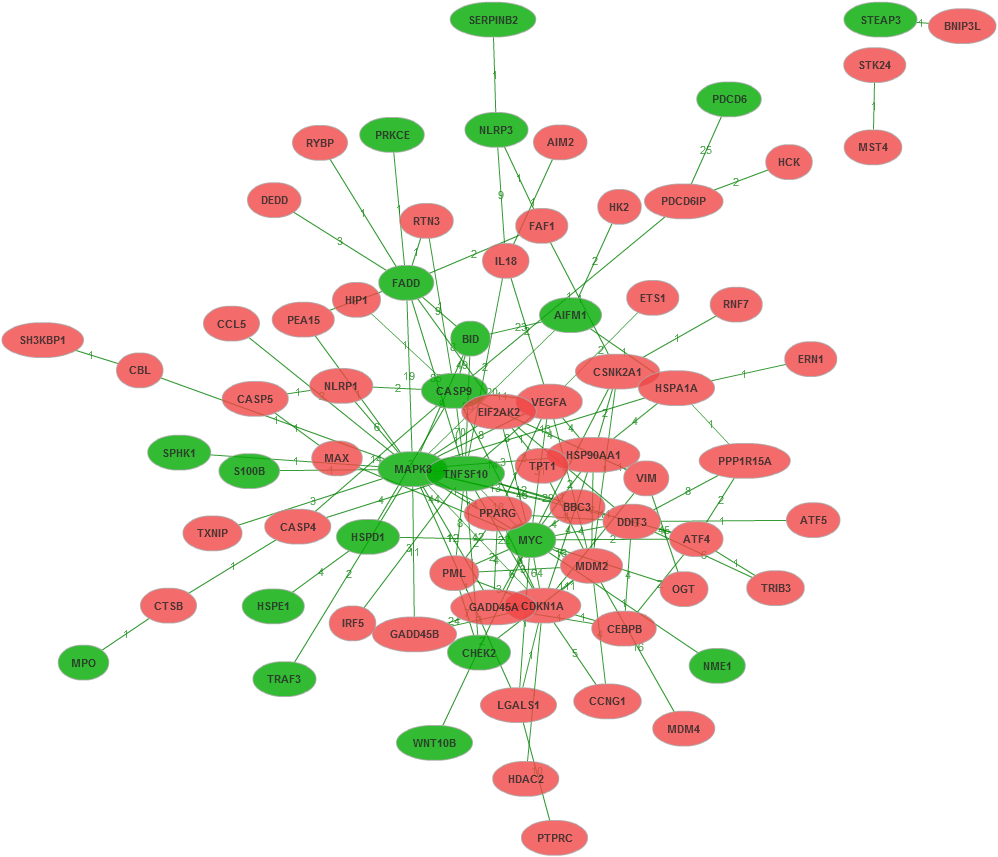
Nodes in this graph represent genes. Edges correspond to literatures that associate two genes with each other. The label above each edge of the result networks indicates the number of related articles. Right-click the edge or number and click 'View Interaction Details in New Window' can link to the articles that the two genes co-occurrence in a sentence.
To simplify the network or remove wrong gene pair, users can delete the genes and the edges. Right-click a gene and Select First Neighbors can select genes associated with this gene. Or press shift and click multiple genes and edges. And then right-click the selected element to delete.
For up- and down-regulated genes.
Random simulation is performed to determine whether the analyzed gene list is related to the specified keywords, and/or engaged in the same gene networks related to the specified keywords.
The limited times of random simulation are generated following gene network construction, as two functions' procedures are similar. When the simulation times reach 1000 or the duration reach 20 seconds, the primary random simulation will be terminated.
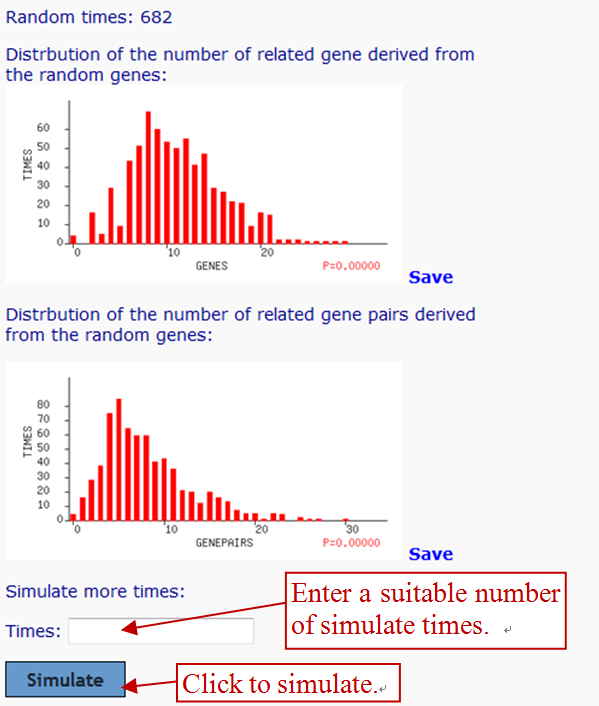
The number of analyzed genes, the number of related genes, the number of related gene pairs, and the average number of articles per gene are derived from analyzed genes automatically. For each simulation, the same number of genes as the number of the analyzed genes are randomly picked from the full gene set. The average number of literature per gene for them should be between 75 and 125% of that for the analyzed genes. The number of interactive gene pairs, even two genes and inputted keywords must share the same sentence or abstract, are counted. And genes involved in gene pairs are calculated.
After random simulations, if the distribution of the number of related genes (or gene pairs) is similar to the expected normal distribution, and the probability that a set of randomly picked genes contain the same or more related genes (or gene pairs) as the analyzed genes do is less than 0.05 (i.e. P < 0.05), then it can be inferred that the gene relatedness is not random.
The drawback of the random simulation is that the most costly computation, the generation of the list of random gene, must be redone each time, which makes the analysis considerably longer than the other analyses. So we limit the largest random times you can select, no more than 10 thousands or 10 times of primary random times, which are simulated within 20 seconds. Under this restricted condition, the process will run within 4 minutes. Users can input the simulation times across the result page of the gene network. When registered users review the gene network, the random simulation result that have used the biggest number of times will be selected and showed.
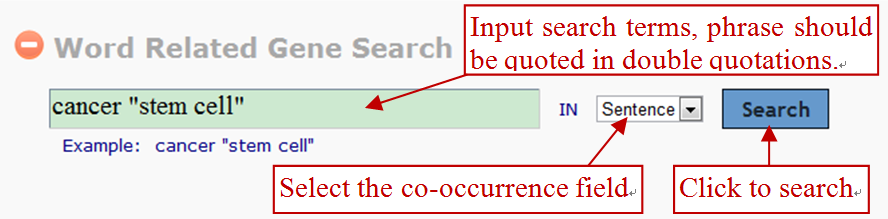
Generally, Word Related Gene Search will allow you to identify genes that are related to your specific query. This feature is useful for identifying genes associated with diseases, phenotypes, function, etc. In many cases, your search term will correspond to various genes or proteins.
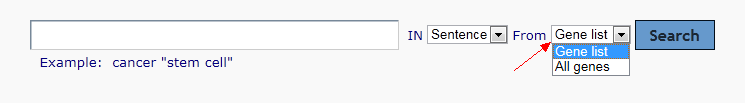
Search words and genes which are appearing together in the sentence or abstract can be searched. User can select from the drop-down selection menu, default is in a sentence. As following description, the co-occurrence of search words and genes in the sentence will be considered. Specially, the result genes can be based on you input genes.
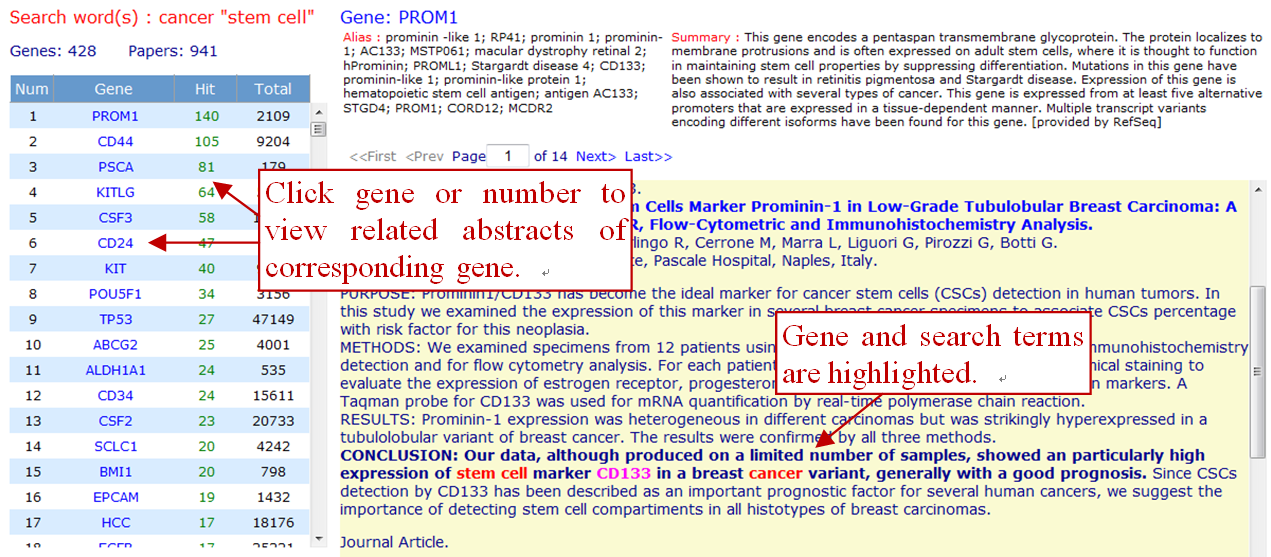
You can use the function to see the list of genes matching an arbitrary query, then click on the "number of articles" or "official symbol" can link to a particular gene and relevant literatures. The result will be some sentences matching both your search terms and the gene indicated. The gene list is sorted by frequency, genes with the highest number of articles mentioning them are shown at the top of the list.
- The Gene column lists the genes found in the sentences identified by your search term(s).
- The Hit column lists the number of articles(multiple sentences may in one abstract) mentioning the corresponding gene that also contains your search term(s).
- The Total column lists the number of articles mentioning the corresponding gene.
The synonyms section displays lists of aliases for each gene known by GenCLiP 2.0. The summary section displays each gene's summary offered by NCBI. It is worth noting that many gene or protein synonyms are ambiguous, thus one and the same synonym is often used for different genes. Even human experts can have difficulties to resolve such ambiguities and automatic systems, like iHOP, will therefore always exhibit certain errors. In many cases, experts will recognize incorrectly identified synonyms simply by scanning a sentence.
The article view section displays literatures of the corresponding gene. The default is 10 articles per page, unless there are fewer than 10 articles identified. If a search result contains more than one page, user can select page through click the button. The system sorts matching articles based upon their publication dates, the most recent article first.
GenCLiP 2.0 highlights key information(including gene/protein, search word, even the sentence) on the original abstract, which improves user readability. Gene/Protein names are indicated by magenta color, search words are displayed by red color, while sentences are highlighted by bold fonts.
Some tips:
(i). Searches are case-insensitive: MYC and myc will find the same set of results.
(ii). To search for sentences or articles containing more than one search term (logical "AND" searches), separate the terms with a space. As an example, cancer stem cell finds sentences mentioning cancer, stem and cell.
(iii). To search a phrase that contains spaces, place the phrase in quotation marks. For example, "cancer stem cell" finds articles mentioning the multi-word "cancer stem cell", so the articles would be more specific. If you did not place quotation marks around cancer stem cell, then the system would find more article, but less specific.
(v). Boolean searching (the use of AND, OR, and NOT operators) is not currently supported. To perform an "AND" search, enter the search terms with spaces in between each term. Such as, mir target , which identifies articles mentioning both mir and also target, then users can find some microRNAs and their targets easily.
GenCLiP 2.0 provides three modules to identify the most relevant (over represented) biological keywords associated with a given gene list.
Generally, annotated biological terms are abundant and multifarious, bring a impending need for classifying them into groups. Condensing large annotation lists into biologically meaningful modules greatly improves our ability to assimilate large amounts of information and thus switches functional annotation analysis from a gene-centric analysis to a biological module-centric analysis. To identify the related biological terms can help biologists to assemble a bigger biological picture for better understanding biological themes.
DAVID proposed a novel clustering algorithm, named fuzzy cluster, to address this problem efficiently. Fuzzy cluster algorithm classifies highly related terms into functionally related groups. Typically, a biological term is a cooperation of a set of genes. As an example, if two or more biological processes are done by a similar set of genes, the processes might be related to the biological network somehow.
This algorithm adopts kappa statistics to quantitatively measure the degree of the agreement how terms share the similar participating genes for. After scanning all pairs of the given term to other terms, the closely related terms to the given one could be listed and sorted. Kappa result ranges from 0 to 1. The higher the value of Kappa, the stronger of the agreement. Kappa more than 0.7 typically indicates that the agreement of two terms are strong. Kappa values greater than 0.9 are considered excellent. The higher setting, the less terms will be put into clustered group, which leads to higher quality of functional classification result with fewer groups and a fewer term members. Kappa value 0.3 starts giving meaningful biology based on DAVID's genome-wide distribution study. Anything below 0.3 has a great chance to be noise.
Here we modify some steps of DAVID's fuzzy cluster to algorithm adapt our approach. GenCLiP 2.0 uses a similar fuzzy clustering concept as functional classification by measuring relationships among the annotation terms on the basis of the degree of their co-association with genes within the user’s list to cluster somewhat heterogeneous, yet highly similar annotation into functional annotation groups. The main steps as follows:
Step 1: The statistical significance of a term is assessed by chi-square test, P<0.05 is considered significant. Measure the relationships of all term-term pairs with Kappa statistics. The threshold of kappa value is 0.45.
Step 2: Each term annotates a number of genes, array the numbers in ascending. From small to big, each term connects with their most closely related term which has the biggest Kappa value. And then, two single terms will be clustered in a group, or a single term will be put into a formed group. If two terms have been assigned into groups, they would not be merged.
Step 3: After cluster processing, the terms will be divided into groups or singles. Calculate the enrichment score of group, which is geometric mean of minus log transformation of p-value of those terms involved in groups. Single terms are also scored by the minus log transformation of p-value. The result table shows the groups and single terms by arraying the score in descending.
Key Points:
- Number of total groups is dynamically determined based on the given genes and different threshold (p-value, hit genes and total genes).
- Fuzziness: measure the relationship by shared identical genes.
- An annotation just belongs to one cluster or be a single.
This type of grouping of functional annotation can give a more insightful view of the relationships between annotation categories and terms compared with the traditional linear list of enriched terms, as highly related annotation terms may be dispersed among hundreds, if not thousands, of other terms. This reduces the burden of associating different terms associated with the similar biological process, thus allowing the biological interpretation to be more focused at the biological module level. Empty report means that there are no annotations passed the specified threshold. It does not mean that no annotation exists.